While we focus micro, the end of the year is a logical time to think about broad macro and risk more deeply.
The 2021 recovery is obviously going to rely on the vaccine rollout. GS has forecast curves anticipating 50% coverage in developed markets by the late second quarter and vaccinations of those under age 12 starting in the fourth quarter. Barclays also has a timeline of expected vaccines through 2021. In the first half, you have JNJ, Novavax, and two GSK vaccines expected to join Pfizer, Moderna, and AstraZeneca. And then in the second half of the year, you have Arcturus and Merck.
For more details the vaccine rollout, you can look at the Vaccine Allocation Planner which lets you look at available vs. needed vaccinations on the state level and by priority population.
As we review 2020 and look to 2021, this is what’s at top-of-mind:
A. Expect a tepid travel recovery, with traffic recovery to the 2019 baseline in late 2022 and recovery in hotel rates as late as 2025. Outdoor dining data indicated an underlying desire of people to eat out, but the industry is essentially in a post-apocalyptic state right now.
B. Expect restructuring and widespread closure of movie houses. Even with streaming options, the majority of people still want to go to the movies. But widespread vaccination in time for the summer blockbuster season is unlikely. Don’t expect normalcy until 2022 at the earliest.
C. The pandemic saw strength in lower cost cities like Charlotte, Dallas, Houston, Austin, and Nashville. Going forward, the willingness to expand housing supply in cities like Seattle, Dallas, and Austin puts them at an advantage over San Francisco. New York faces its greatest fiscal challenge since the 1970s, as do many other municipalities across the U.S.
D. See no reason for rates to rise. “Overheating the economy” with $2,000 checks is not a concern.
E. Economic consequences of the pandemic elevate social and political risk going forward.
A. Travel & Leisure
Oliver Wyman forecasts a recovery in air travel to 2019 in mid-2022 at the earliest. A prolonged recovery would be mid-2023. Actual Air Revenue Passenger Miles were at 29% of their 2019 levels in September 2020 while TSA checkpoint numbers were in the upper-30% to lower-40% range by the end of December. This suggests we’re on a path that’s somewhere between Oliver Wyman’s baseline and prolonged projections for long-term air travel.

Source: U.S. Bureau of Transportation Statistics, Air Revenue Passenger Miles [AIRRPMTSI], retrieved from FRED, Federal Reserve Bank of St. Louis; https://fred.stlouisfed.org/series/AIRRPMTSI, December 27, 2020.

Source: TSA. Accessed December 28, 2020.
For hotels, STR is more bearish, with Average Daily Rates not reaching their 2019 levels until at least 2025. As the seniors get vaccinated, maybe 90%+ immunogenicity would compel people to proceed with deferred retirement trips. But judging from traffic during Thanksgiving and Christmas, visiting families will likely be the top priority.
Business travel, however, should pick up towards the fall when the prime working age population starts getting vaccinated. Since kids won’t get vaccinated until 4Q21, travel to, say, Disneyland and Disney World, are unlikely to reach their 2019 levels until at least 2022.
As for restaurants, the pandemic has been absolutely apocalyptic. Those able to survive (a) were part of a larger group—and even then Momofuku closed Nishi and CCDC; (b) had the pre-existing infrastructure to execute on delivery (see: DPZ US <Equity> <GO>); or (c) had diners who were willing to support it during the pandemic.
With outdoor dining, at restaurants open for reservations, seated covers approached 90% of last year’s levels at the beginning of September. This suggests lots of pent-up demand for dining out. As to whether we can get back to 2019 levels, that all depends on vaccination.
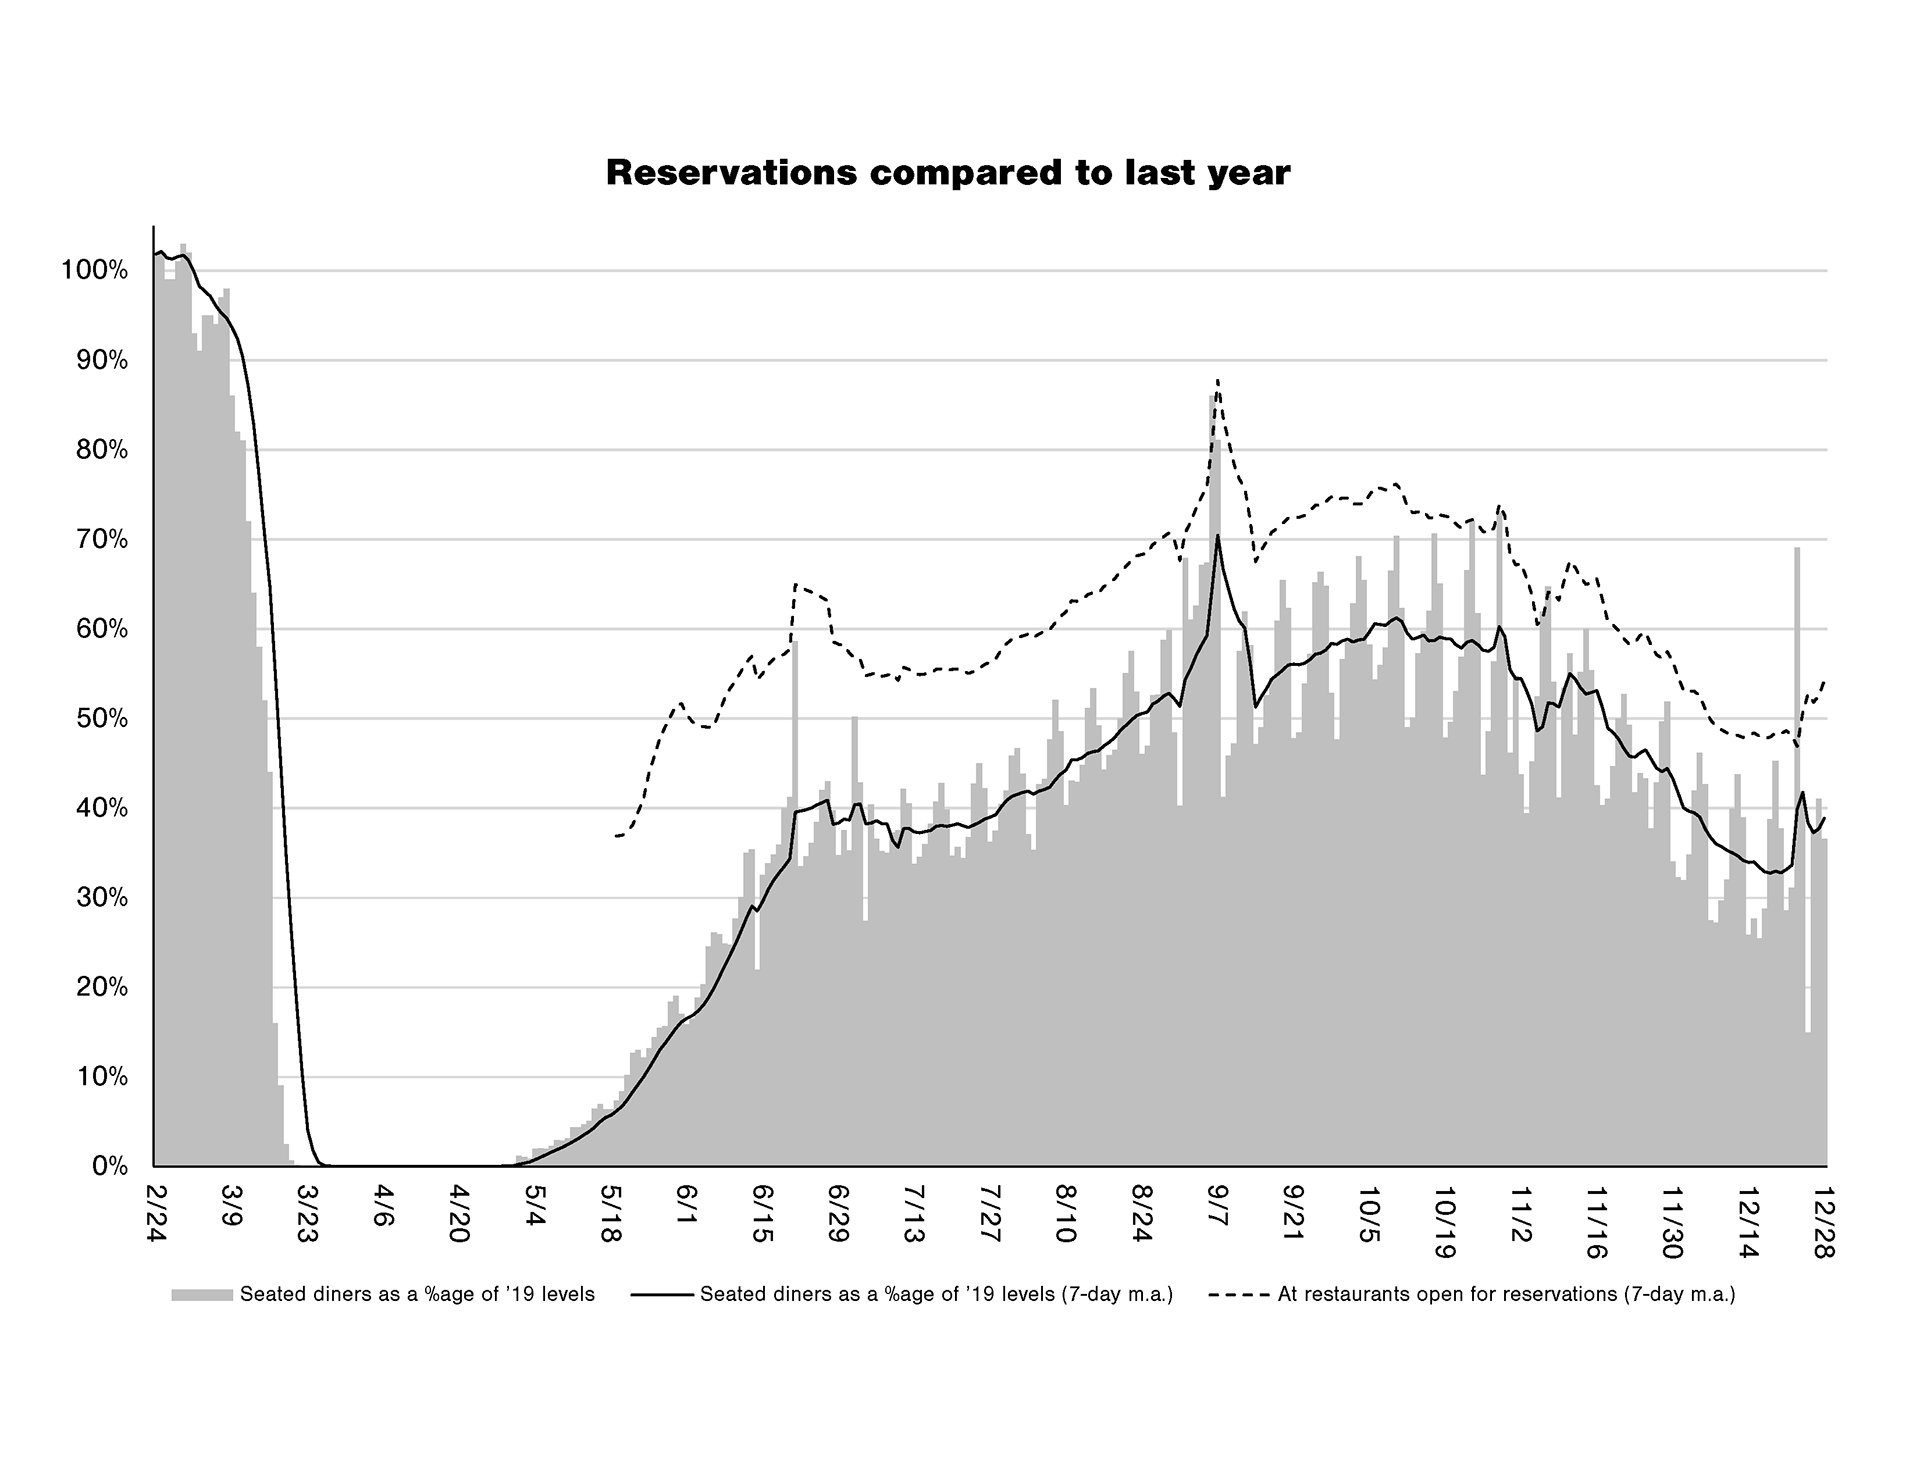
Source: OpenTable.
B. The Movies
Another industry completely contingent on vaccination is the movie industry. WW84 pulled in $16.7 million opening weekend across 2,151 theatres in the middle of a pandemic. Pre-pandemic, Rise of Skywalker pulled in $177 million across 4,406 theatres. Obviously, you can’t compare the franchises directly since Star Wars is a much stronger brand, but as of this writing (December 28), 2020 overall B.O. is $2.1 billion, compared to $11.3 billion the year before.
If under-12s don’t get vaccinated until 4Q21, then we’re also going to miss the summer blockbuster season. With Oscar season traditionally happening in 4Q and with only adults being fully vaccinated at that time, it’s possible that awards season films are the only ones that will come anywhere close to have normalized sales. Last year’s Best Picture winner Parasite only pulled in $53 million in the domestic B.O. during its entire run, less than the haul of a typical opening weekend for a blockbuster.
Even before COVID, cinema needed to be completely reimagined. Theatres are completely filled from Thursday through Sunday—that’s presuming you have a hit movie—while they sit virtually empty for the rest of the week. Capacity utilization needs to be increased. During the pandemic, Malco Theatres rented to the University of Memphis and started making branded popcorn for grocery stores in order to survive. That’s one model, but it’s impossible for AMC and Regal to do that at scale.
Restructuring* should help theatres get out of the least productive leases, but premium formats could be another way to take capacity out of the system. While Dolby advertises visual fidelity and sound quality, another benefit to the theatre is that the recliners take up a lot more space than a traditional movie seat. Conversion would nevertheless require a lot of capital investment, which doesn’t seem in the cards.
*AMC filed an S-3 for 200 million shares. With the stock closing at $2.39 on December 28th, if you add the £100 European credit facility and the new $100 million in 15%/17% Cash/PIK Toggle First Lien Secured Notes, you get close to the filling the $750 million in liquidity needs, but still don’t have enough to get through 2021. I’m not missing anything, right? AMC is heading towards bankruptcy?
Additionally, WarnerMedia announced the elimination of the theatrical window. While other studios are unlikely to follow immediately since HBO Max underperformance was a factor in the decision, this does raise the question of whether theatres need to exist in the age of streaming. While cinephiles went to the theatre to watch The Irishman or Roma, that’s still an infinitesimal portion of the market.
There is nevertheless still a meaningful level of pent-up demand. According to Deloitte, 45% of U.S. subscribers were attracted to a specific subscription service for original content and 51% of Millennials with kids rented at least one Paid Video on Demand film to watch a new release (compared to 22% of U.S. consumers as a whole). Still, despite the ability to watch new releases at home, 60% of Gen Z and Millennials surveyed wanted to watch a movie in the theatre within the next six months.
Anecdotally, reissues of films like Blade Runner, Lawrence of Arabia, and 2001: A Space Odyssey have sold-out theatres before. The common factor aside from the prerequisite of being a great movie: they’re visual spectacles that demand to be seen on the big screen. Would you watch Dune at home?
Based on buzz, we would easily be willing to watch a theatrical release of Soul (though we would skip WW84 and Tenet). There’s lots of pent-up demand, so a full Roaring ’20s scenario wouldn’t be out of the question for 2022.
C. Cities
In 2020, people fled New York because the global interconnectedness which had been one of its greatest advantages became its biggest disadvantage. New York was hit with the first major wave because, while the West Coast cities had Chinese travel blocked, New York was the main port of entry from Europe, which remained open.
The density* of cities was another advantage that had turned into a disadvantage. The pandemic accelerated movement out of the urban core towards cheaper suburbs and exurbs.
*Density is a red herring and is distinct from overcrowding. Overcrowding, a product of wealth and race, is far more predictive of COVID spread than density. See NYU analysis of New York and ProPublica analysis of Chicago.
With work-from-home, do we still need to gather in cities? Why have an office in San Francisco when you can decamp to Austin? If you look at the change in daily asking rents per square foot in 2020, the ordinal ranking tracks pretty close to housing affordability in 2018, the most recent year for which data are available. Prices in the most expensive cities decreased while prices in the most affordable cities increased.
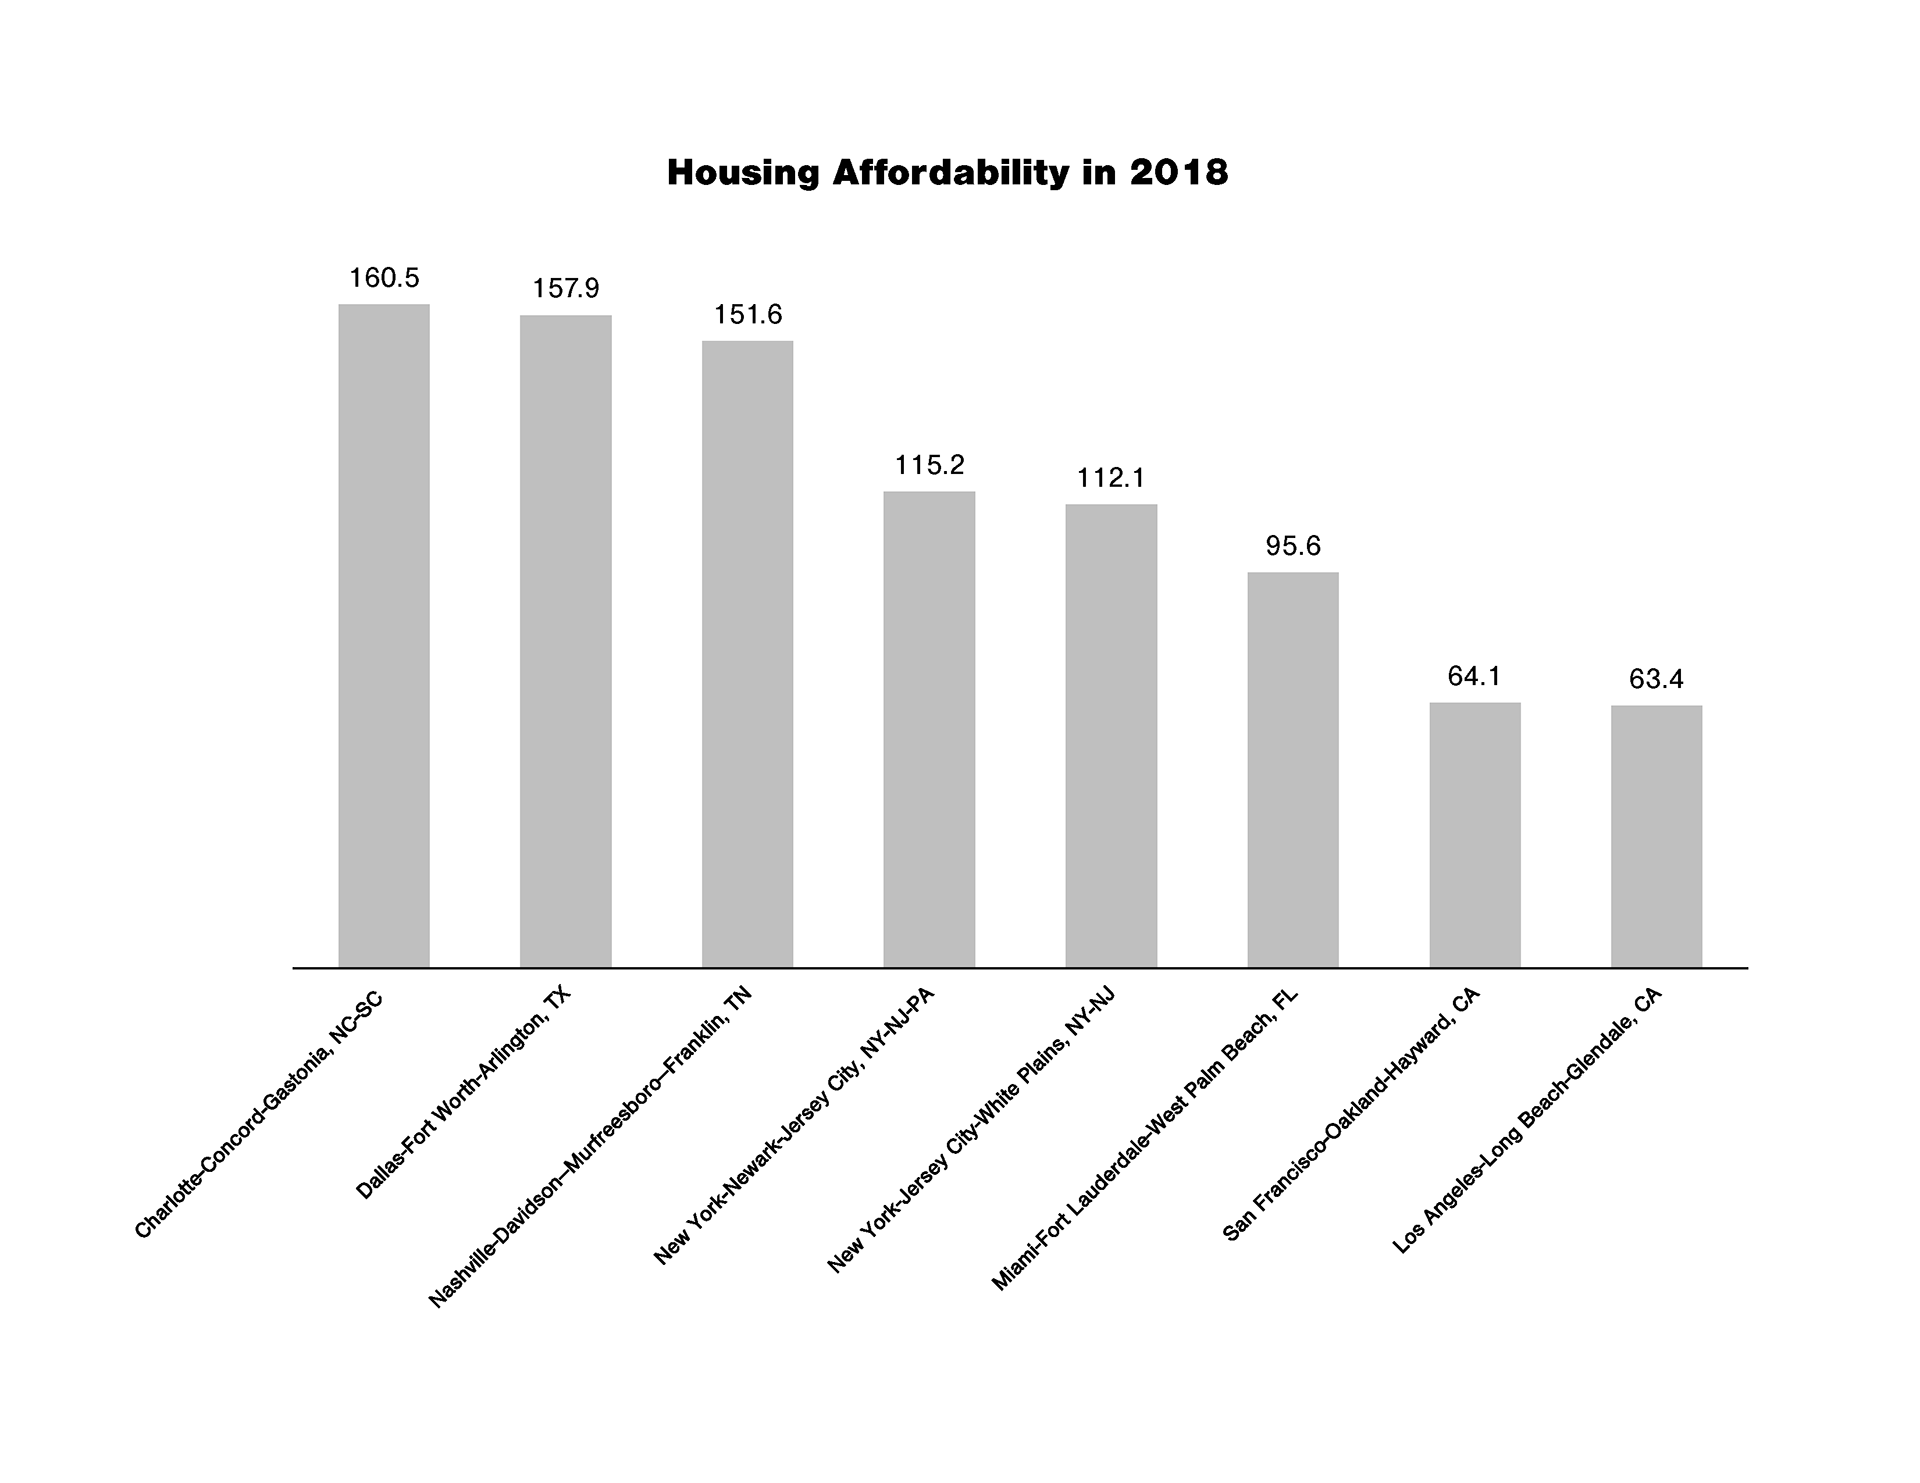
Source: NAR. Housing affordability is the ratio of median income to the qualifying income for a mortgage at prevailing interest rates. The higher the ratio, the more affordable it is.
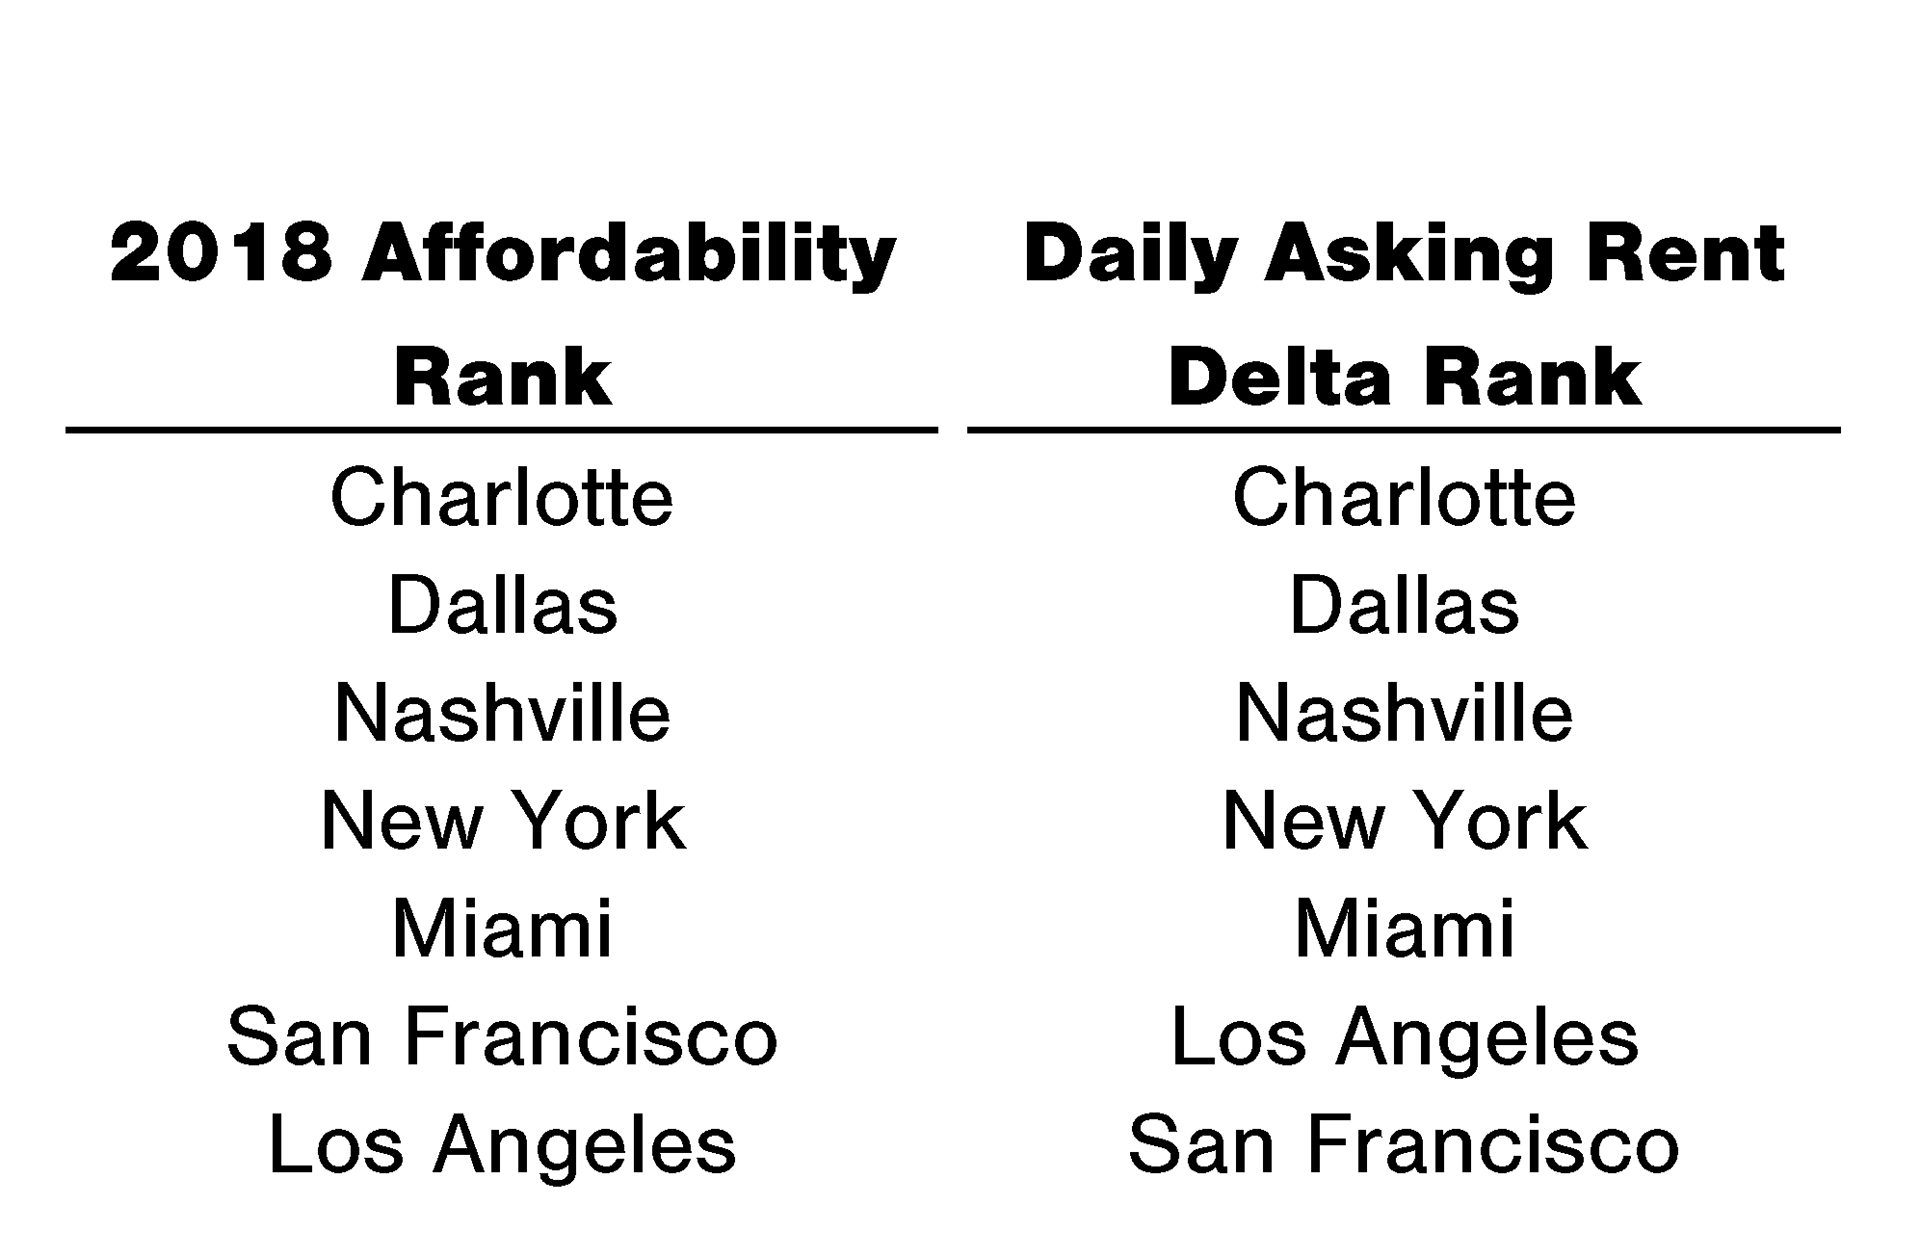
Sources: Cities ranked based on affordability in 2018 from NAR (left) and change in daily asking rents per square foot from Wells Fargo (right).
For businesses, office card swipes have gone down the most in the Bay Area and New York and been most resilient in Dallas, Houston, and Austin. Office rents are up 6.8% in Los Angeles and up 5.3% in Austin, compared to down 6.6% in San Francisco and down 5.4% in Midtown Manhattan.
We were asked early in the pandemic whether migration away from cities was going to be permanent. While the idea of a remote corporation is more viable in the Zoom era, there needs to be at least some level of colocation. The benefits to agglomeration are too great. It is much easier to design a product when you’re in the same city as your factory.
Our cities have bounced back before. New York had the draft riots of 1863. London had The Blitz. Paris and Singapore had Axis occupation. Berlin had partition. But they remain.
But the recovery of a city is not inevitable. Special Enterprise Zones and charter cities show how much governance decides success or failure. If San Francisco continues to restrict expansion in housing supply, then it will continue to lose residents to Seattle and Texas.
Prior to the pandemic, Yardi Matrix projected 22,196 new apartment units in Dallas, 13,682 in Seattle, 13,418 in New York, 13,031 in Miami, and 10,783 in Austin. Compare this to 6,044 in San Jose and 5,334 in San Francisco. As of July, the RLB U.S. Crane Index reported 43 construction cranes in Seattle, 42 in Los Angeles, and 38 in Washington, D.C., compared to 24 in San Francisco and 12 in New York.
As for New York, given its reliance on travel and tourism, a full recovery won’t happen until we reach herd immunity. With a 40% reduction in revenue, the MTA is faced with operating deficits through 2024. Service reductions, delays & reductions in capital investment, and fare & toll increases seem inevitable. As a barometer, the spread for MTA municipal bonds over AAA-rated benchmark yields went from 33 bps to 338 bps this year.
It took New York a generation to dig out of its 1970s fiscal hole; the last of Big MAC’s bonds were retired in 2008. The difference this time is that New York wasn’t the only city adversely impacted. During the first wave of the pandemic, from March to May 2020, state tax revenue in the U.S. was down 29% compared to last year. The hardest hit states were Oregon (-53%), Alaska (-45%), California (-42%), New York (-37%), New Jersey (-36%), and Hawaii (-34%).
States fared much better during the summer. Analysis of the first nine months of 2020 by the Tax Foundation showed state tax revenues in aggregate declining 4.4% compared to same period last year. Among the hardest hit were energy-dependent states like Alaska (-26%) and North Dakota (-23%) as well as Connecticut (-25%), Hawaii (-17%), and Washington (-16%). Interestingly, state tax receipts in New York were actually only down 2.7% in the same time period while California’s were down 3.6%.
Once cyclical industries like tourism and energy start to recover, then we should see that reflected in the receipts of states with such exposures. It’s not going to look as bad in retrospect as it does now, but this is all contingent on how quickly vaccinations can get us to herd immunity.
D. Debt and Rates
As of December 2020, consensus estimates for rates were under 2% through 2023. Bond market vigilantes are nowhere to be seen.
Older policymakers have a worldview that was shaped by the stagflationary shock of the late 1970s. However, a new generation of economists seems more concerned about rates in the opposite direction. For instance, at the Bank of England, Paul Schmelzing mapped centuries of interest rates to show that the decline in rates is actually a return to historical trend.
While the stimulus is increasing public sector indebtedness, with U.S. public debt-to-GDP in rising from 107% in 4Q19 to 127% in 3Q20, it’s actually shoring up household balance sheets. The savings rate increased to 33.7% in April 2020, compared to 7.5% the year before. Additionally, the Financial Obligations Ratio is at its lowest level since that data set began in 1980.
Aggregating government, corporate, and household debt, S&P forecasts a 14% rise to 265% global debt-to-GDP in 2020.

Source: BEA. December 23, 2020 revision. Accessed December 28, 2020.
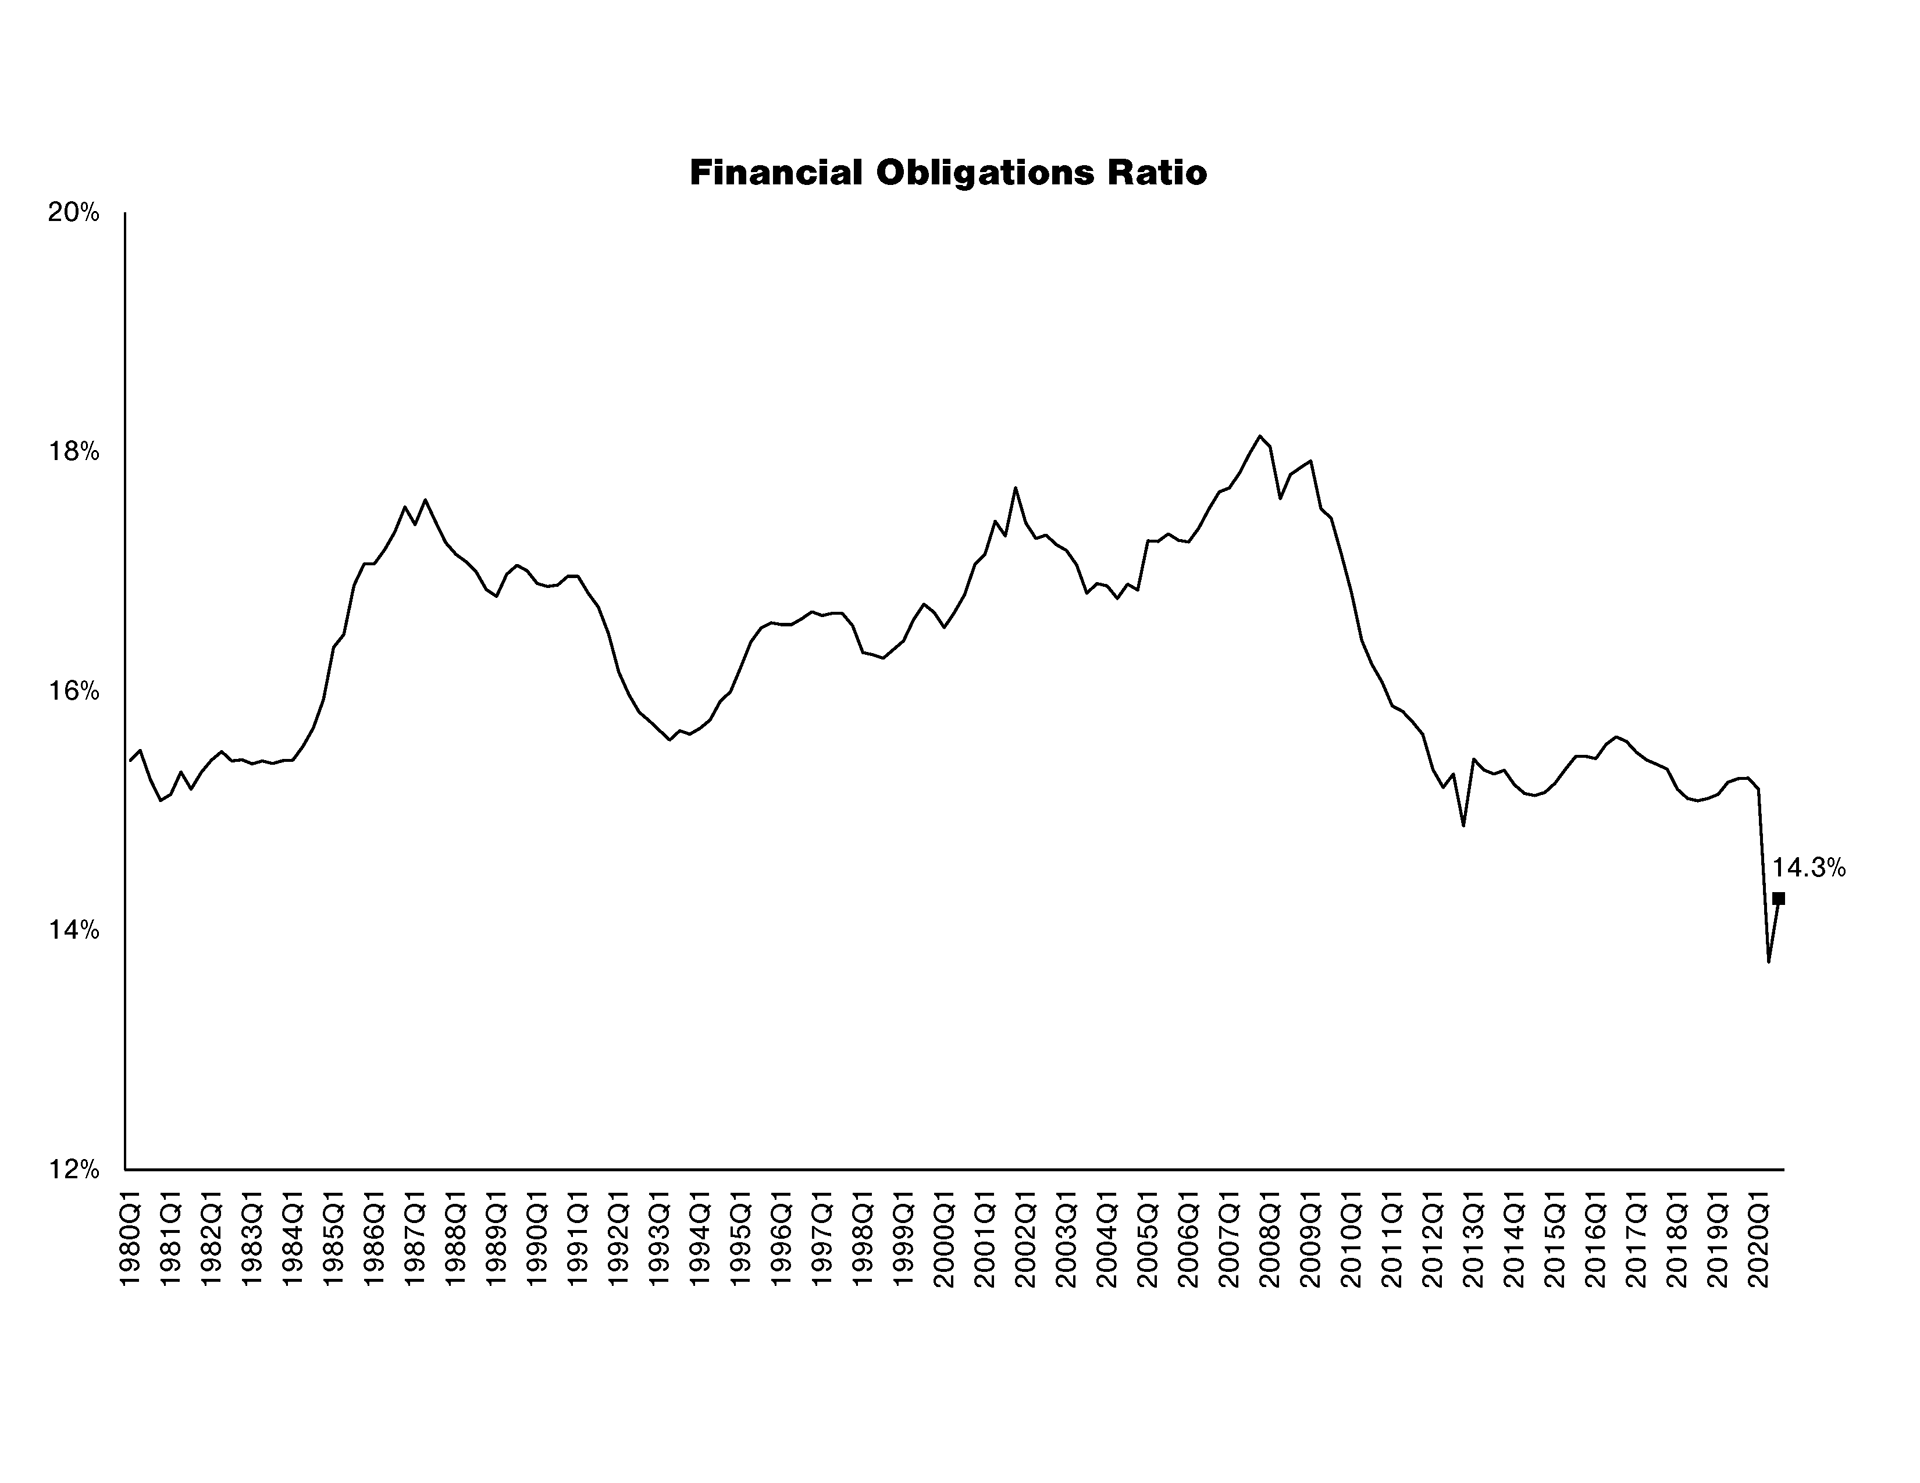
Source: Fed. Household debt service payments and financial obligations (includes rent payments on tenant-occupied property, auto lease payments, homeowners’ insurance, and property tax payment) as a percentage of disposable personal income.
Instead of using the stimulus to buy things, households have been using that stimulus to save and pay down debt. In the first eleven months of 2020, Personal Consumption Expenditures were down 2.8% while Personal Interest Payments were down 15.6%. Governments and corporations are better positioned to raise debt at scale. What the stimulus has essentially done is instead of households taking the burden, governments, which can borrow at the lowest rates, did instead.
Amir Sufi, in his Andrew Crockett Memorial Lecture at the Bank of International Settlements, discussed how traditional models don’t account for the heterogeneity of monetary policy effects. Those with the easiest access to credit are the ones who don’t need the money and are the ones least likely to spend:
For households with a FICO score below 660 (subprime), the marginal propensity to spend out of a dollar increase in the credit limits is more than $0.50, and this effect is realized almost immediately. In contrast, borrowers with the highest FICO scores are almost completely unresponsive.
Since these models don’t fully account for how policy impacts people differently depending on their income or credit history, they ultimately underestimate its simulative effect. While “Tight Credit? Why Ben Bernanke Couldn’t Refinance His Mortgage” was an amusing anecdote after the crisis, it illustrated how the durability of tight credit conditions was a drag on the recovery.
So for 2020, even though the savings rate hit 33.7% in April, those savings were for those with higher incomes. Whereas a third of respondents making between $75,000 and $99,999 used the stimulus to shore up their own balance sheet, almost 9 in 10 households who made $25,000 or less used it to meet expenses (Census).
Even if headline unemployment makes it look like we’re in a robust recovery, food and housing insecurity have gone up since the spring. For households making less than $25,000, 8.8% responded that they often did not have enough to eat, up from 7.2% prior to the pandemic. Furthermore, there has been an increase in households, across all income levels, reporting “no confidence” in their ability to pay rent, with low income households hit the hardest.
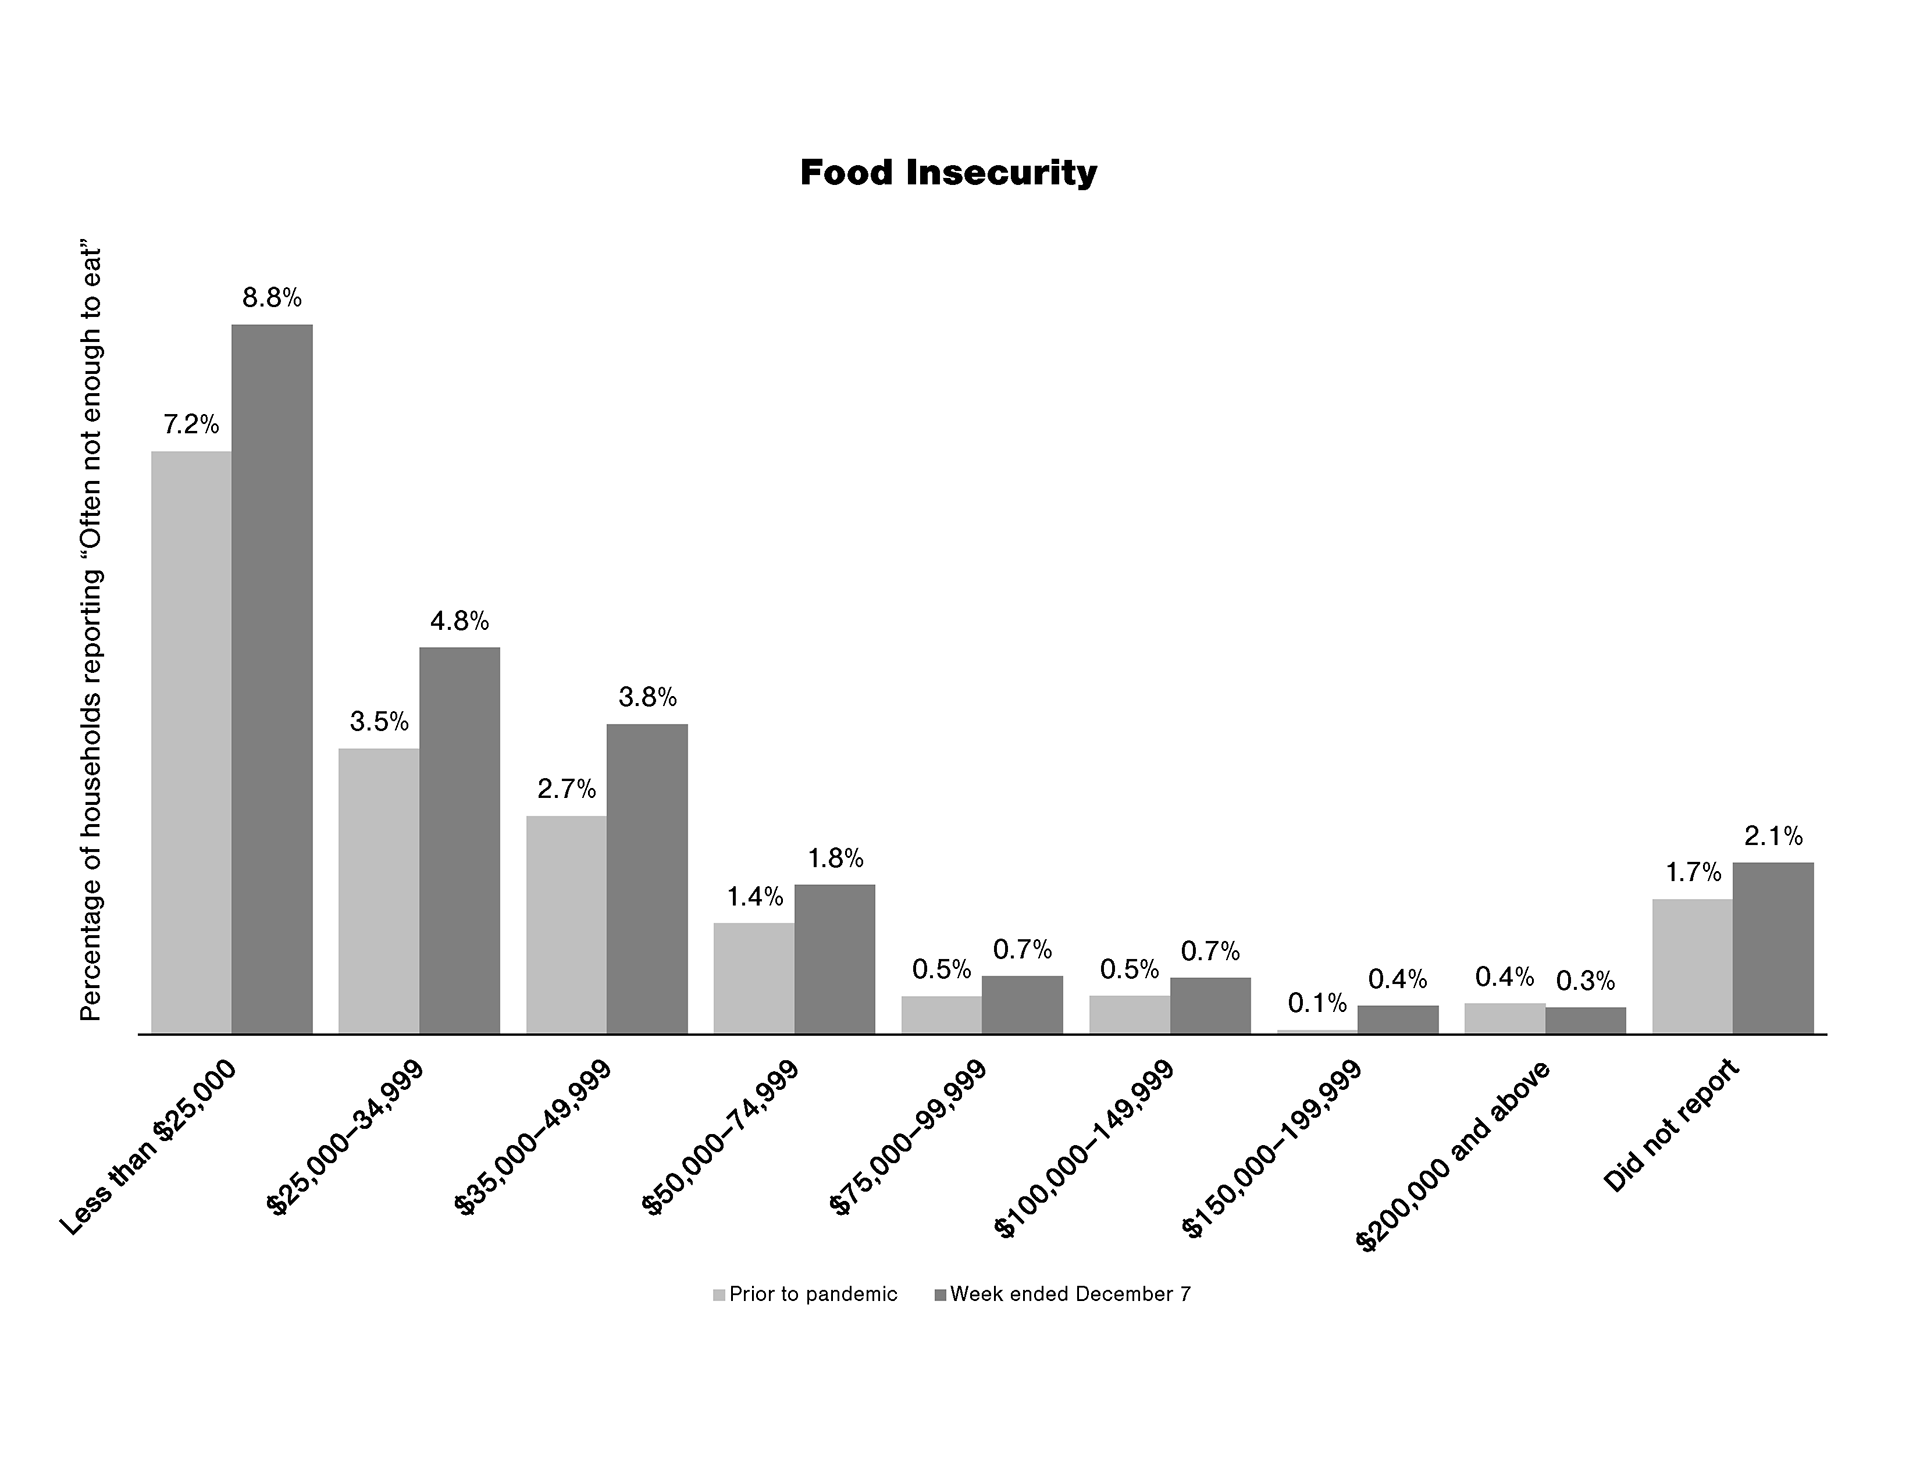
Source: Household Pulse Survey by the Census Bureau.
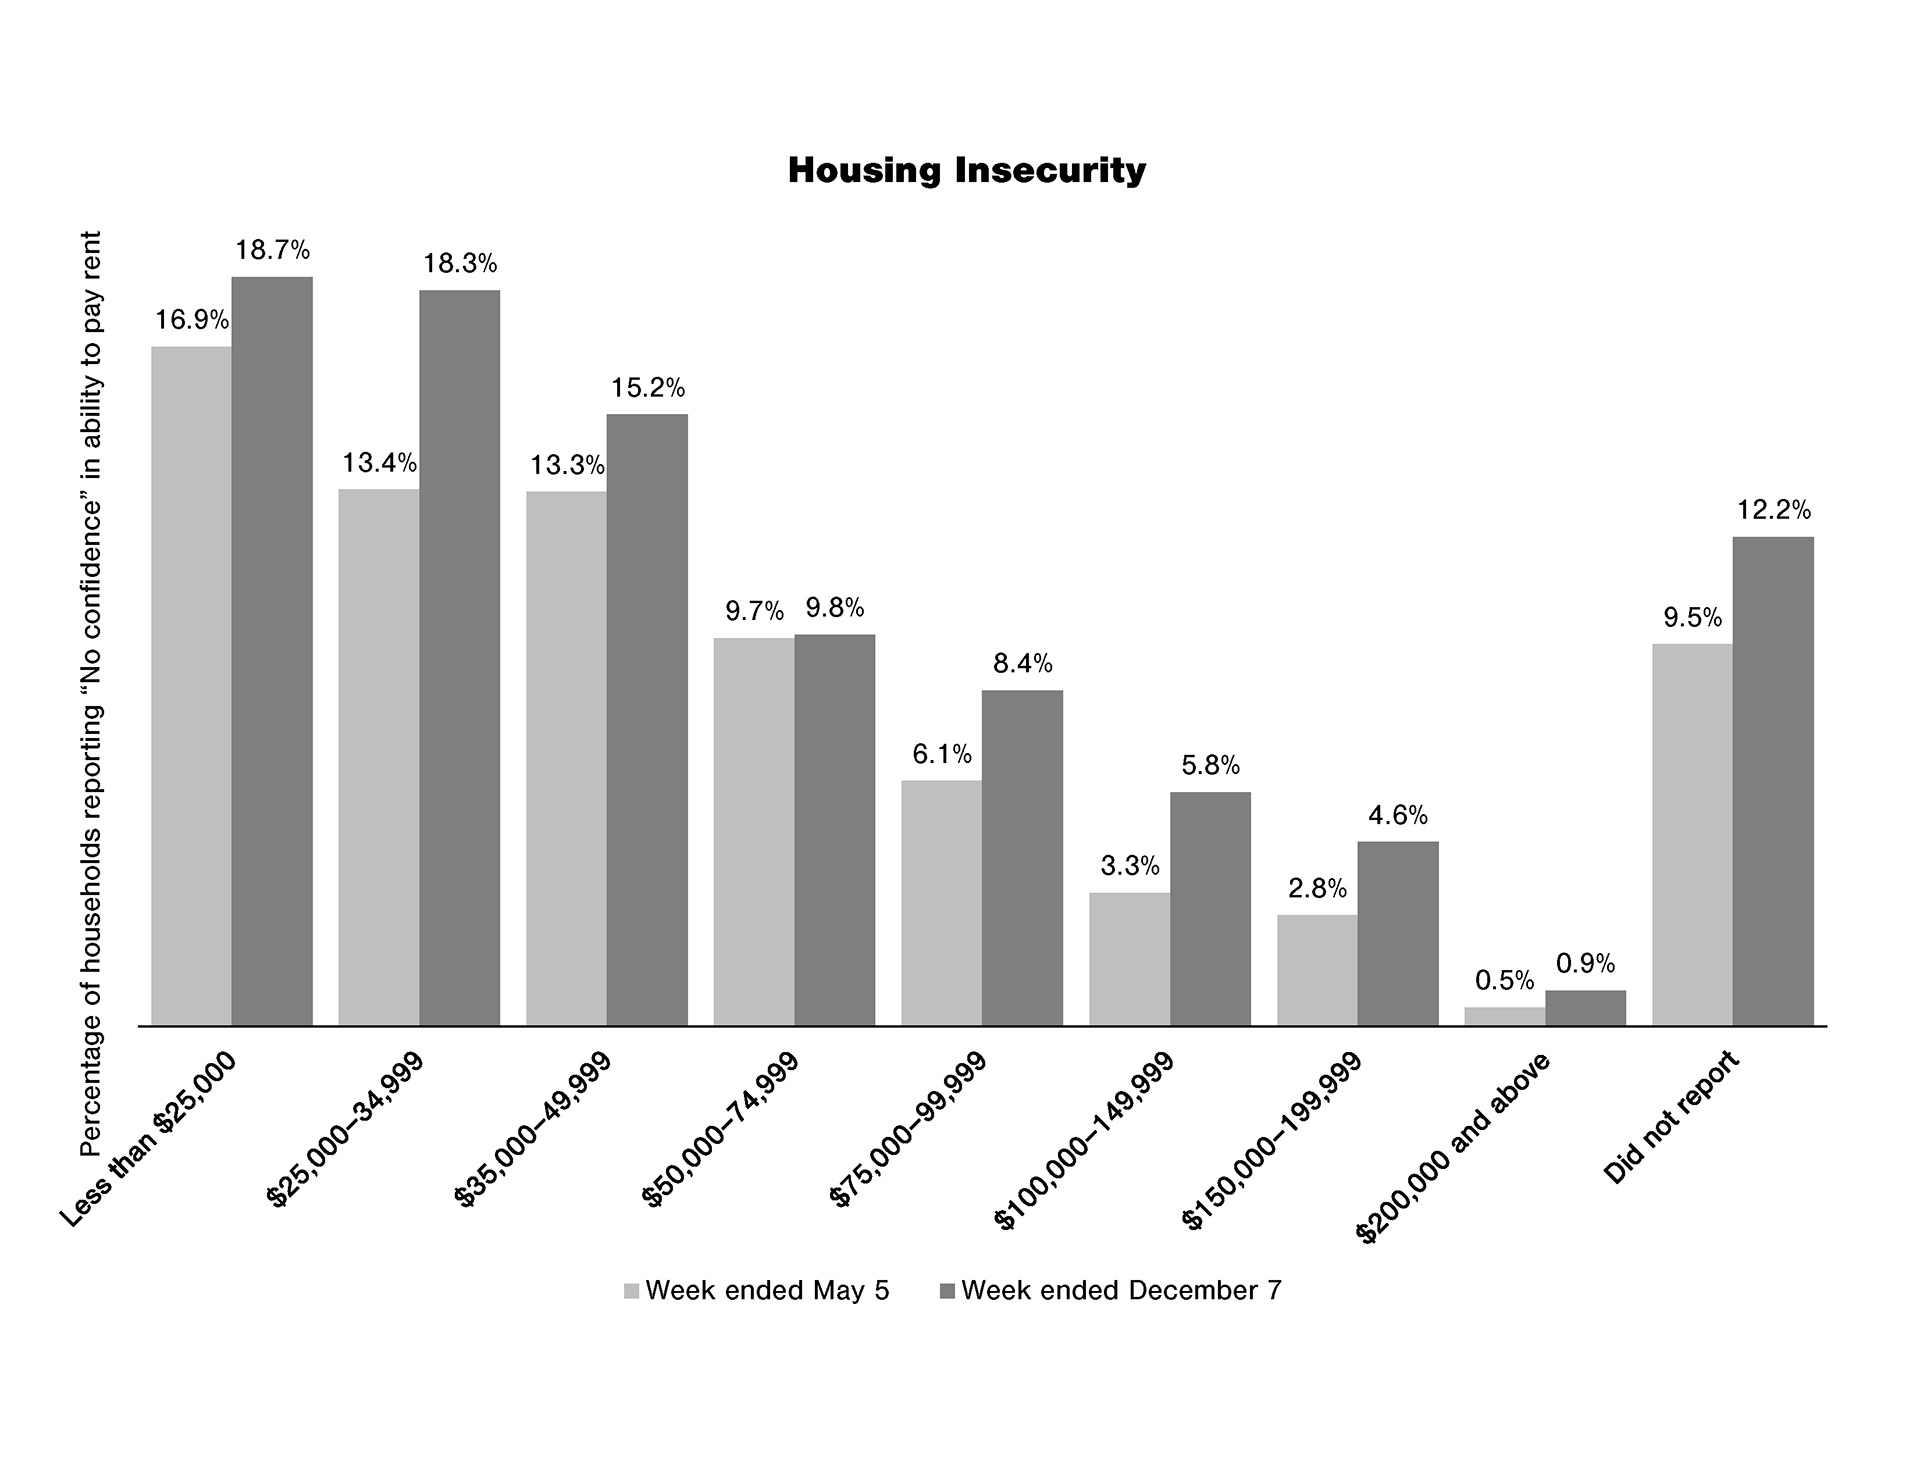
Source: Household Pulse Survey by the Census Bureau.
Is a blanket $2,000 check the best way to do stimulus? No. But there should be far less concern about overheating and more concern about economic stagnation.
E. Social and Political Risk
Whether Woodrow Wilson would have been able to influence the Treaty of Versailles had he not gotten the flu—therefore ensuring the survival of the Weimar Republic—is impossible to surmise. Nevertheless, on a more systematic level, research by the New York Fed has found that extremist parties did better in 1932 and 1933 in areas where flu mortality was greater in 1918–1920.
Inequality is itself a drag on economic development. But a K-shaped recovery is concerning not just for future growth, but also because societal cleavages make violence more likely. The most vivid example is in 1863, when the confluence of inflation, unemployment, discrimination, and conscription ignited the most violent insurrection in American history.

Source: United States Political Violence Database, by Peter Turchin.
Political violence in the United States was highest during Reconstruction, closely followed by World War I. They far surpassed the political violence during the Civil Rights/Vietnam War era. In contrast, the post-Cold War era has been among the most peaceful in American history.
After the Global Financial Crisis, it was surprising there wasn’t more social unrest beyond Occupy. But the economic scale of that crisis was nothing compared to the Great Depression or spring 2020, when unemployment hit 14.7%, the price of meat went up 20%, and pork plants closed amid a viral epidemic.
Combined with a long quarantine from a disease that disproportionately affected Black people (CDC, amFAR), the death of George Floyd was a tipping point (Moody’s: “US racial wealth and income inequality raises sovereign-related social risks”).
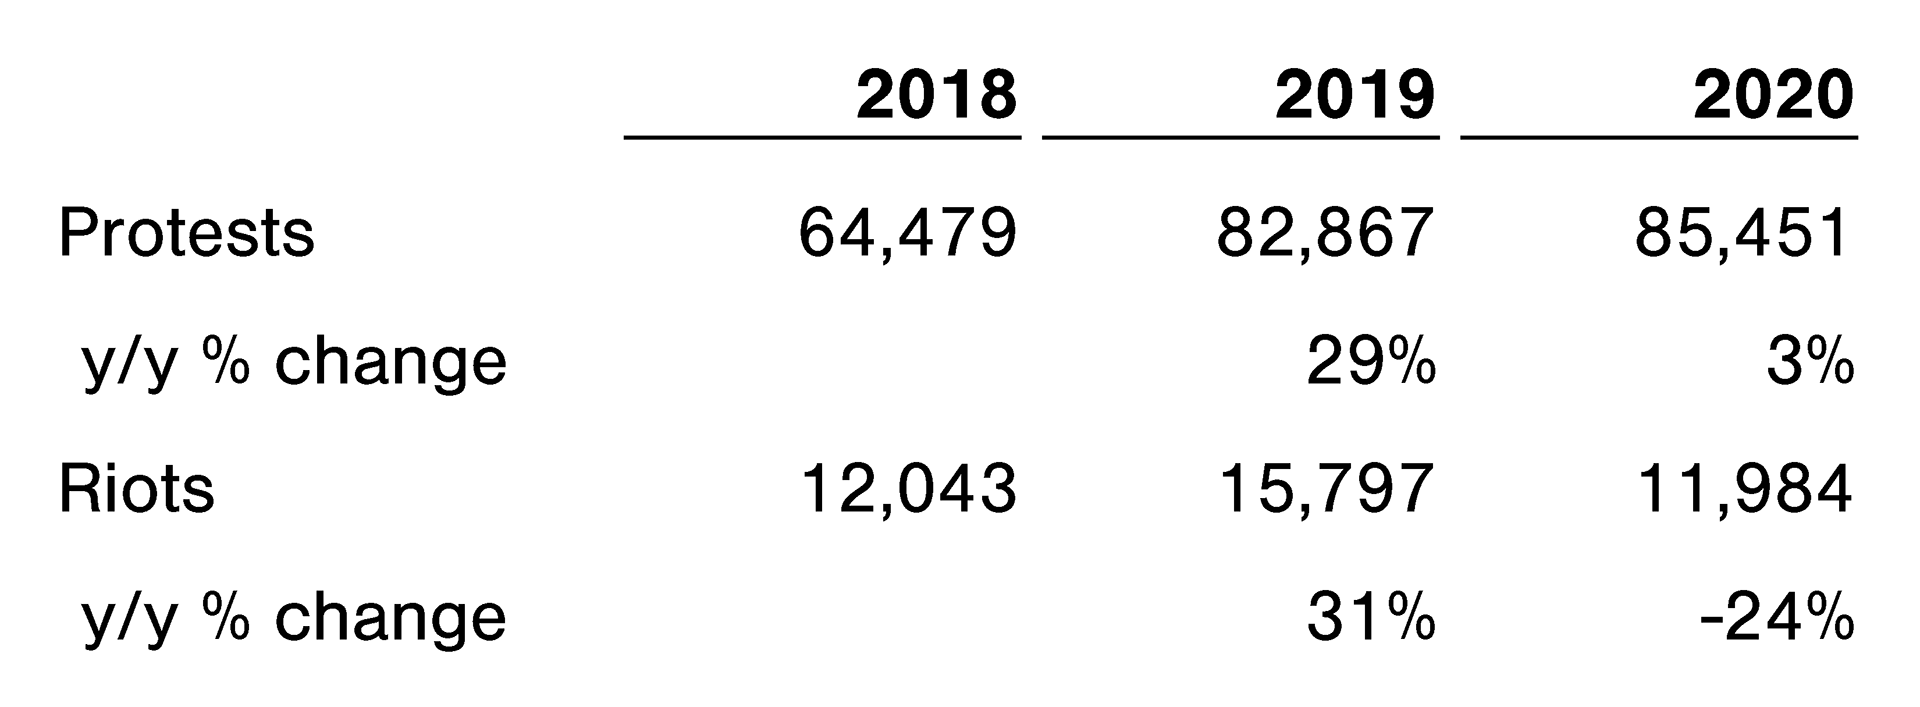
From May 1, 2020 to December 12, 2020 the U.S. Crisis Monitor by ACLED and BDI tracked 742 violent demonstrations, 657 protests with intervention, 102 instances of excessive force against protestors, and 34 instances of mob violence, compared to 17,048 peaceful protests.
As for terror attacks and plots, from January to August 2020, CSIS found perpetrator orientation to be 67% far-right, 20% far-left, 7% Salafi-jihadist, and 7% other (e.g., the Boogaloo movement).
On a global level, perusing the daily security alerts from UHC Global (link is under “Resources for Employers”), a non-exhaustive list of countries with unrest that made headlines in 2020 includes Hong Kong, Liberia, India, Beirut, Zambia, Kazakhstan, Chile, India, Greece, Mozambique, Egypt, Venezuela, Sierra Leone, Poland, Mali, Germany, the United Kingdom, Paraguay, Belarus, Sweden, Israel, Thailand, Nigeria, Italy, Peru, Uganda, Guatemala, and France.
Source: Armed Conflict Location & Event Data Project. Data set for 2020 is partial and ends December 12th.
While protests are up in the Global South, rioting in 2020 was comparable to 2018 levels. However, this doesn’t account for scale and depth (e.g., Hong Kong, Belarus). And it doesn’t illustrate how illustrate how historic the implications can be.
So while a broad analysis can be a starting point, in-depth knowledge of the underlying forces behind a particular incident will provide more predictive value. Various outlooks are available below for more actionable analysis.
But generally, if the vaccination curves are too optimistic and state capacity buckles under a more virulent mutation, then the social and political outlook as we go into 2021 is not optimistic.